ALLSTATE (ALL)·Q4 2025 Earnings Summary
Allstate Crushes Q4 as Combined Ratio Hits Multi-Year Low, Announces $4B Buyback
February 5, 2026 · by Fintool AI Agent
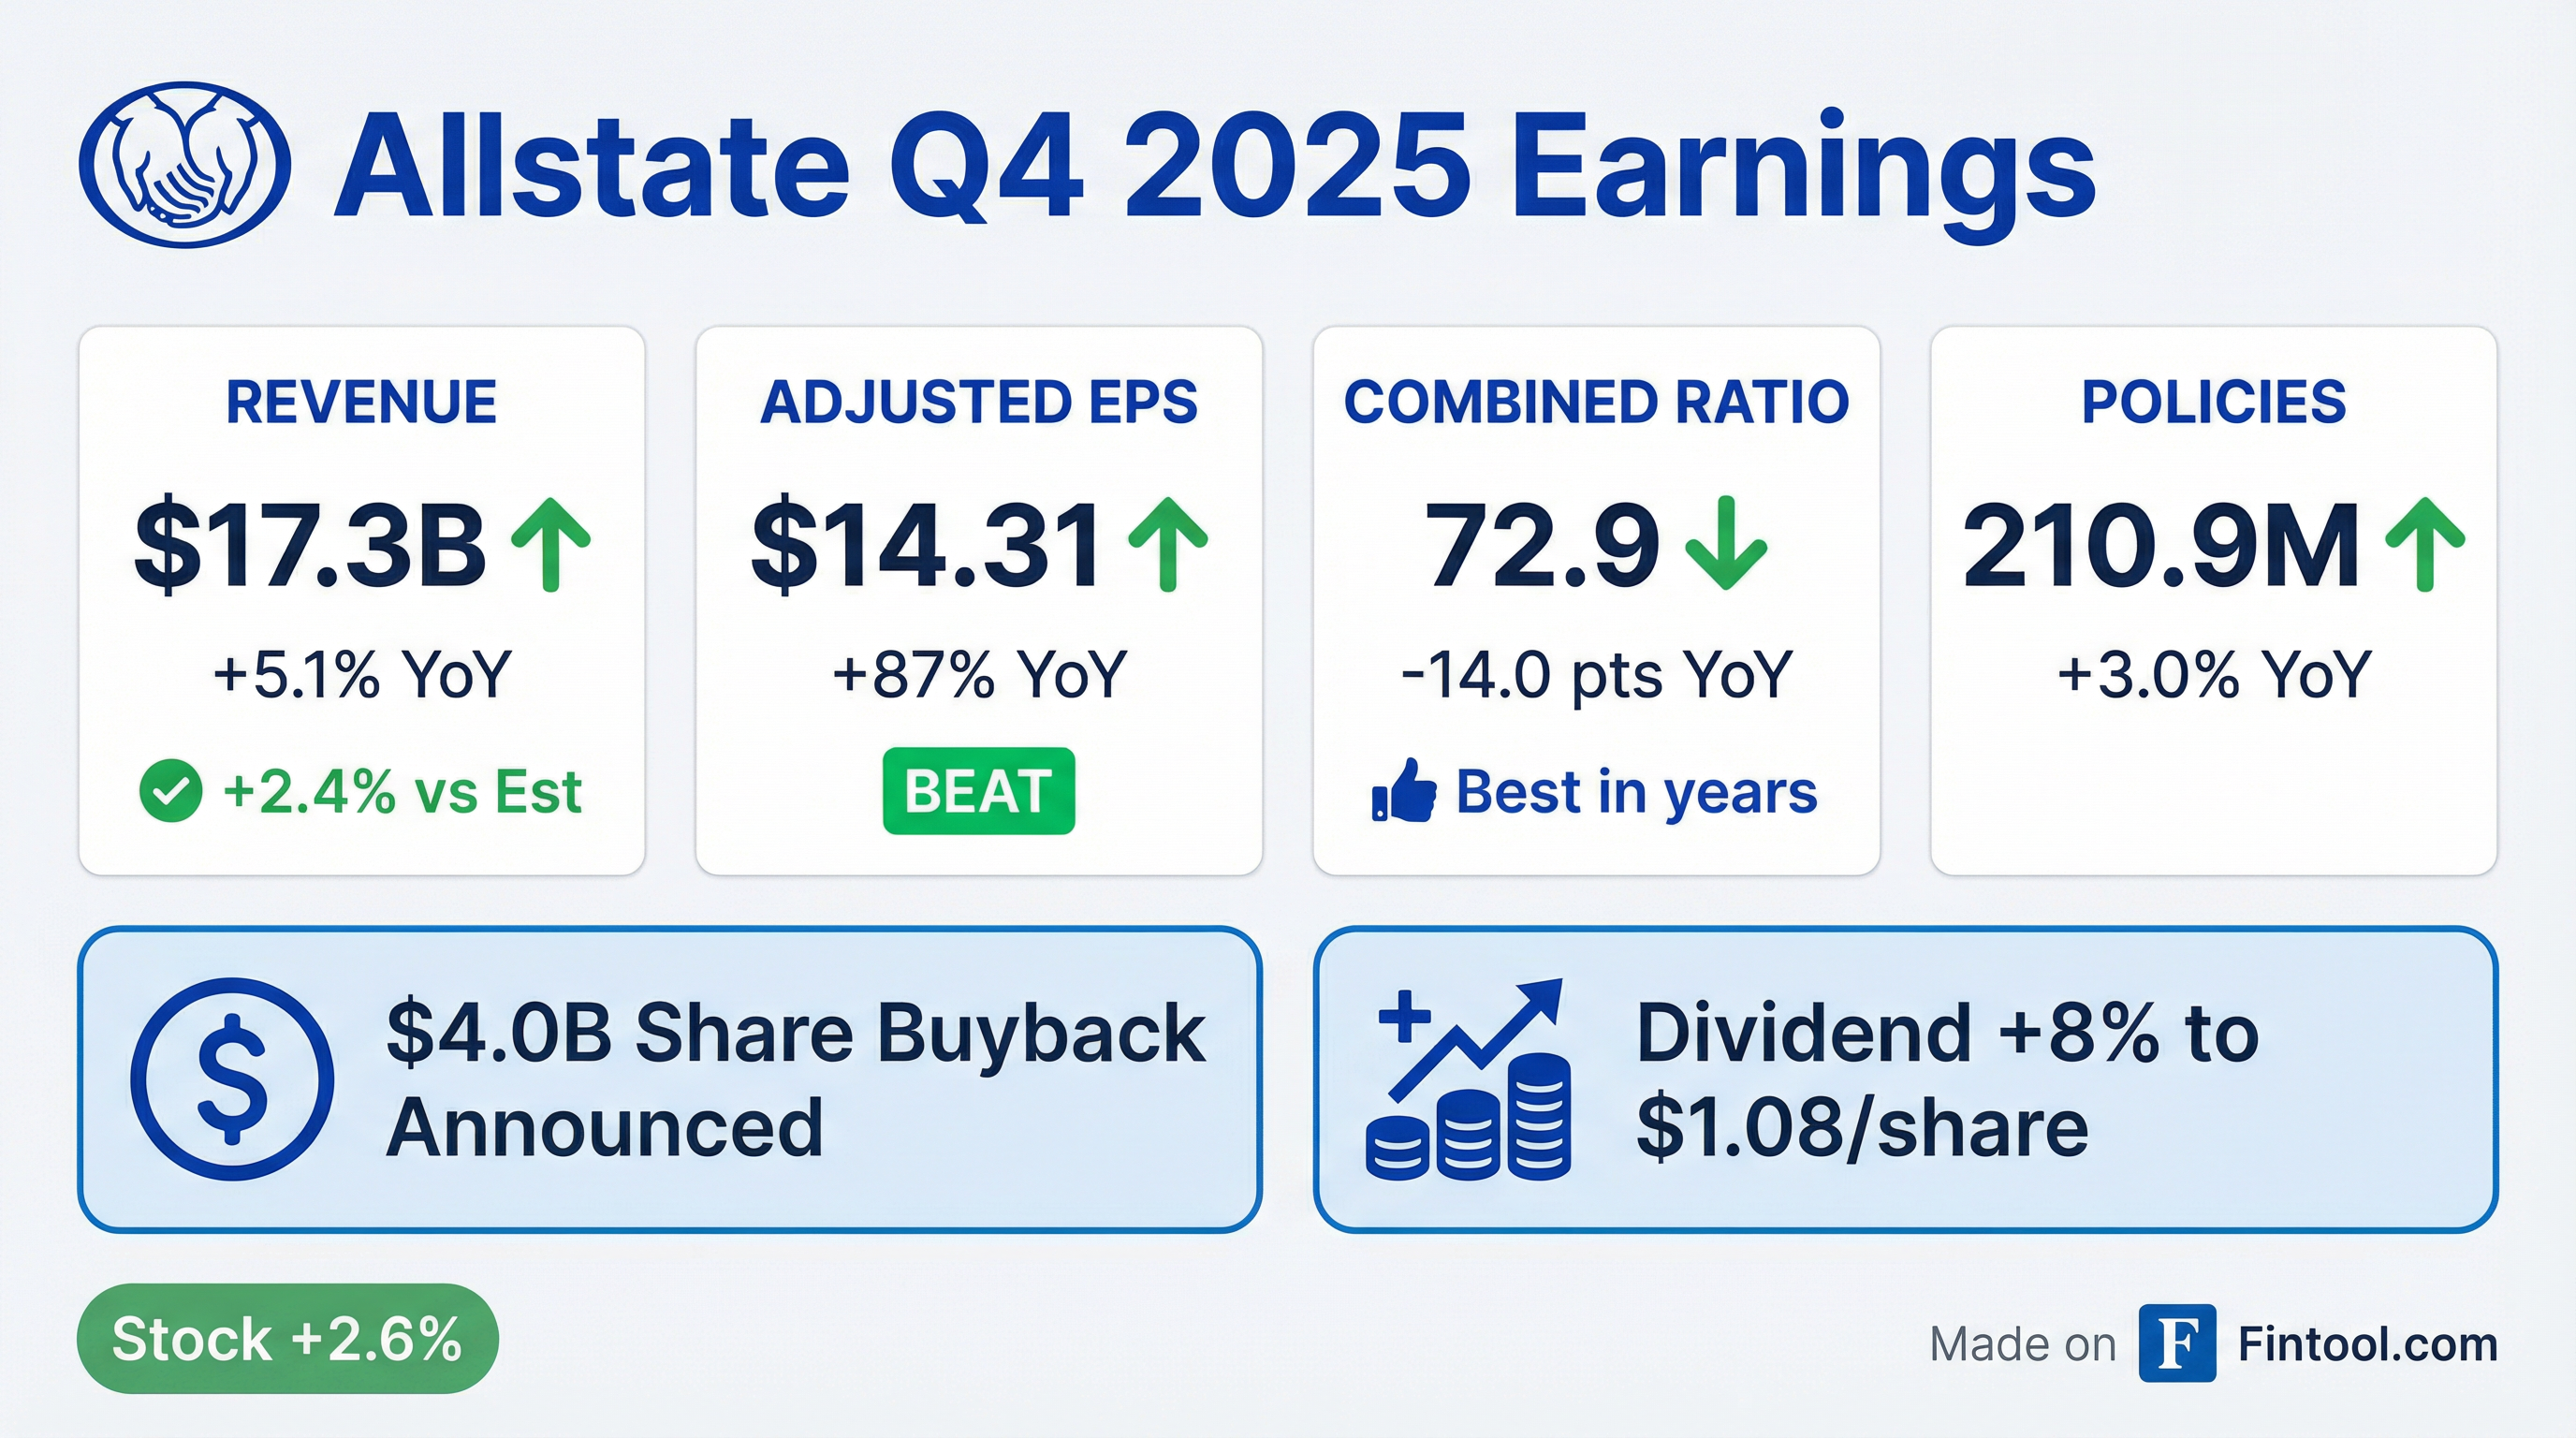
Allstate delivered a blowout Q4 2025, with adjusted EPS of $14.31 nearly doubling year-over-year as the property-liability combined ratio dropped to 72.9—the best quarterly result in years. The company announced a $4 billion share repurchase program and raised its dividend 8% to $1.08 per share, signaling confidence in sustained profitability.
Full-year net income reached $10.2 billion, up 123% from $4.6 billion in 2024, as the Transformative Growth initiative delivered both margin expansion and policy growth.
Did Allstate Beat Earnings?
Yes, decisively. Allstate beat on both revenue and earnings:
The adjusted EPS of $14.31 represents a near-doubling from the prior year quarter. The massive improvement was driven by a 14-point drop in the combined ratio to 72.9, reflecting lower catastrophe losses ($209M vs $410M), favorable reserve development, and moderating loss cost trends.
Full Year 2025 Highlights:
How Did the Stock React?
Allstate shares closed up 2.65% at $207.12 on the earnings release, with aftermarket trading pushing to $209.00.
The stock has gained approximately 18% over the past year, reflecting the turnaround in underwriting profitability. Book value per share surged 50% YoY to $108.45, driven by retained earnings growth.
Industry Leadership: Allstate vs. Peers
Allstate's underwriting performance significantly outpaced the industry:
Homeowners Underlying Combined Ratio Trend (Allstate vs. Industry):
Allstate's homeowners underlying combined ratio of 57.9 in 2025 is the best in this 5-year period, while the industry continues to struggle with profitability.
Industry Cost Pressures (2020-2025):
The auto insurance industry faces significant cost headwinds:
- Physical damage costs increased ~47% over 5 years (43% used car price spike from 2020-2022)
- Injury costs increased ~52% over 5 years
- Uninsured/underinsured motorist claims costs increased 72%
- Industry underwriting profitability has been near zero, with combined ratios averaging ~100
Allstate has outperformed through expense discipline (adjusted expense ratio down 6.6 points since 2018) and improved pricing models.
What Changed From Last Quarter?
The Q4 2025 quarter marked a continuation of the profitability inflection that began in mid-2024:
-
Combined Ratio at Multi-Year Low: 72.9 in Q4 2025 vs 80.1 in Q3 2025 vs 86.9 in Q4 2024
-
Catastrophe Losses Collapsed: Only $209M in Q4 (1.4% of earned premium) vs $558M in Q3 and $410M in Q4 2024. No hurricanes or tropical storms in the quarter.
-
Reserve Releases Provided Tailwind: Prior year non-catastrophe reserve reestimates contributed a 5.4-point benefit to the combined ratio, primarily from favorable severity development in auto injury and physical damage.
-
Policy Growth Accelerated: Total policies reached 210.9 million (+3.0% YoY), with auto new business up 22.8% and homeowners applications up 7.5%.
-
Geographic Growth Broadened: In 2024, only 3 states had >10% policy growth; in 2025, 6 states exceeded 10% growth while states with declines shrank from 13 to 6.
Transformative Growth Distribution Expansion (2019 vs 2025):
Allstate now has the "broadest distribution in the industry" across exclusive agents, independent agents, and direct channels.
Segment Breakdown
Policies in Force (in thousands):
Roadside memberships surged 64% YoY, while Protection Plans added nearly 5 million policies.
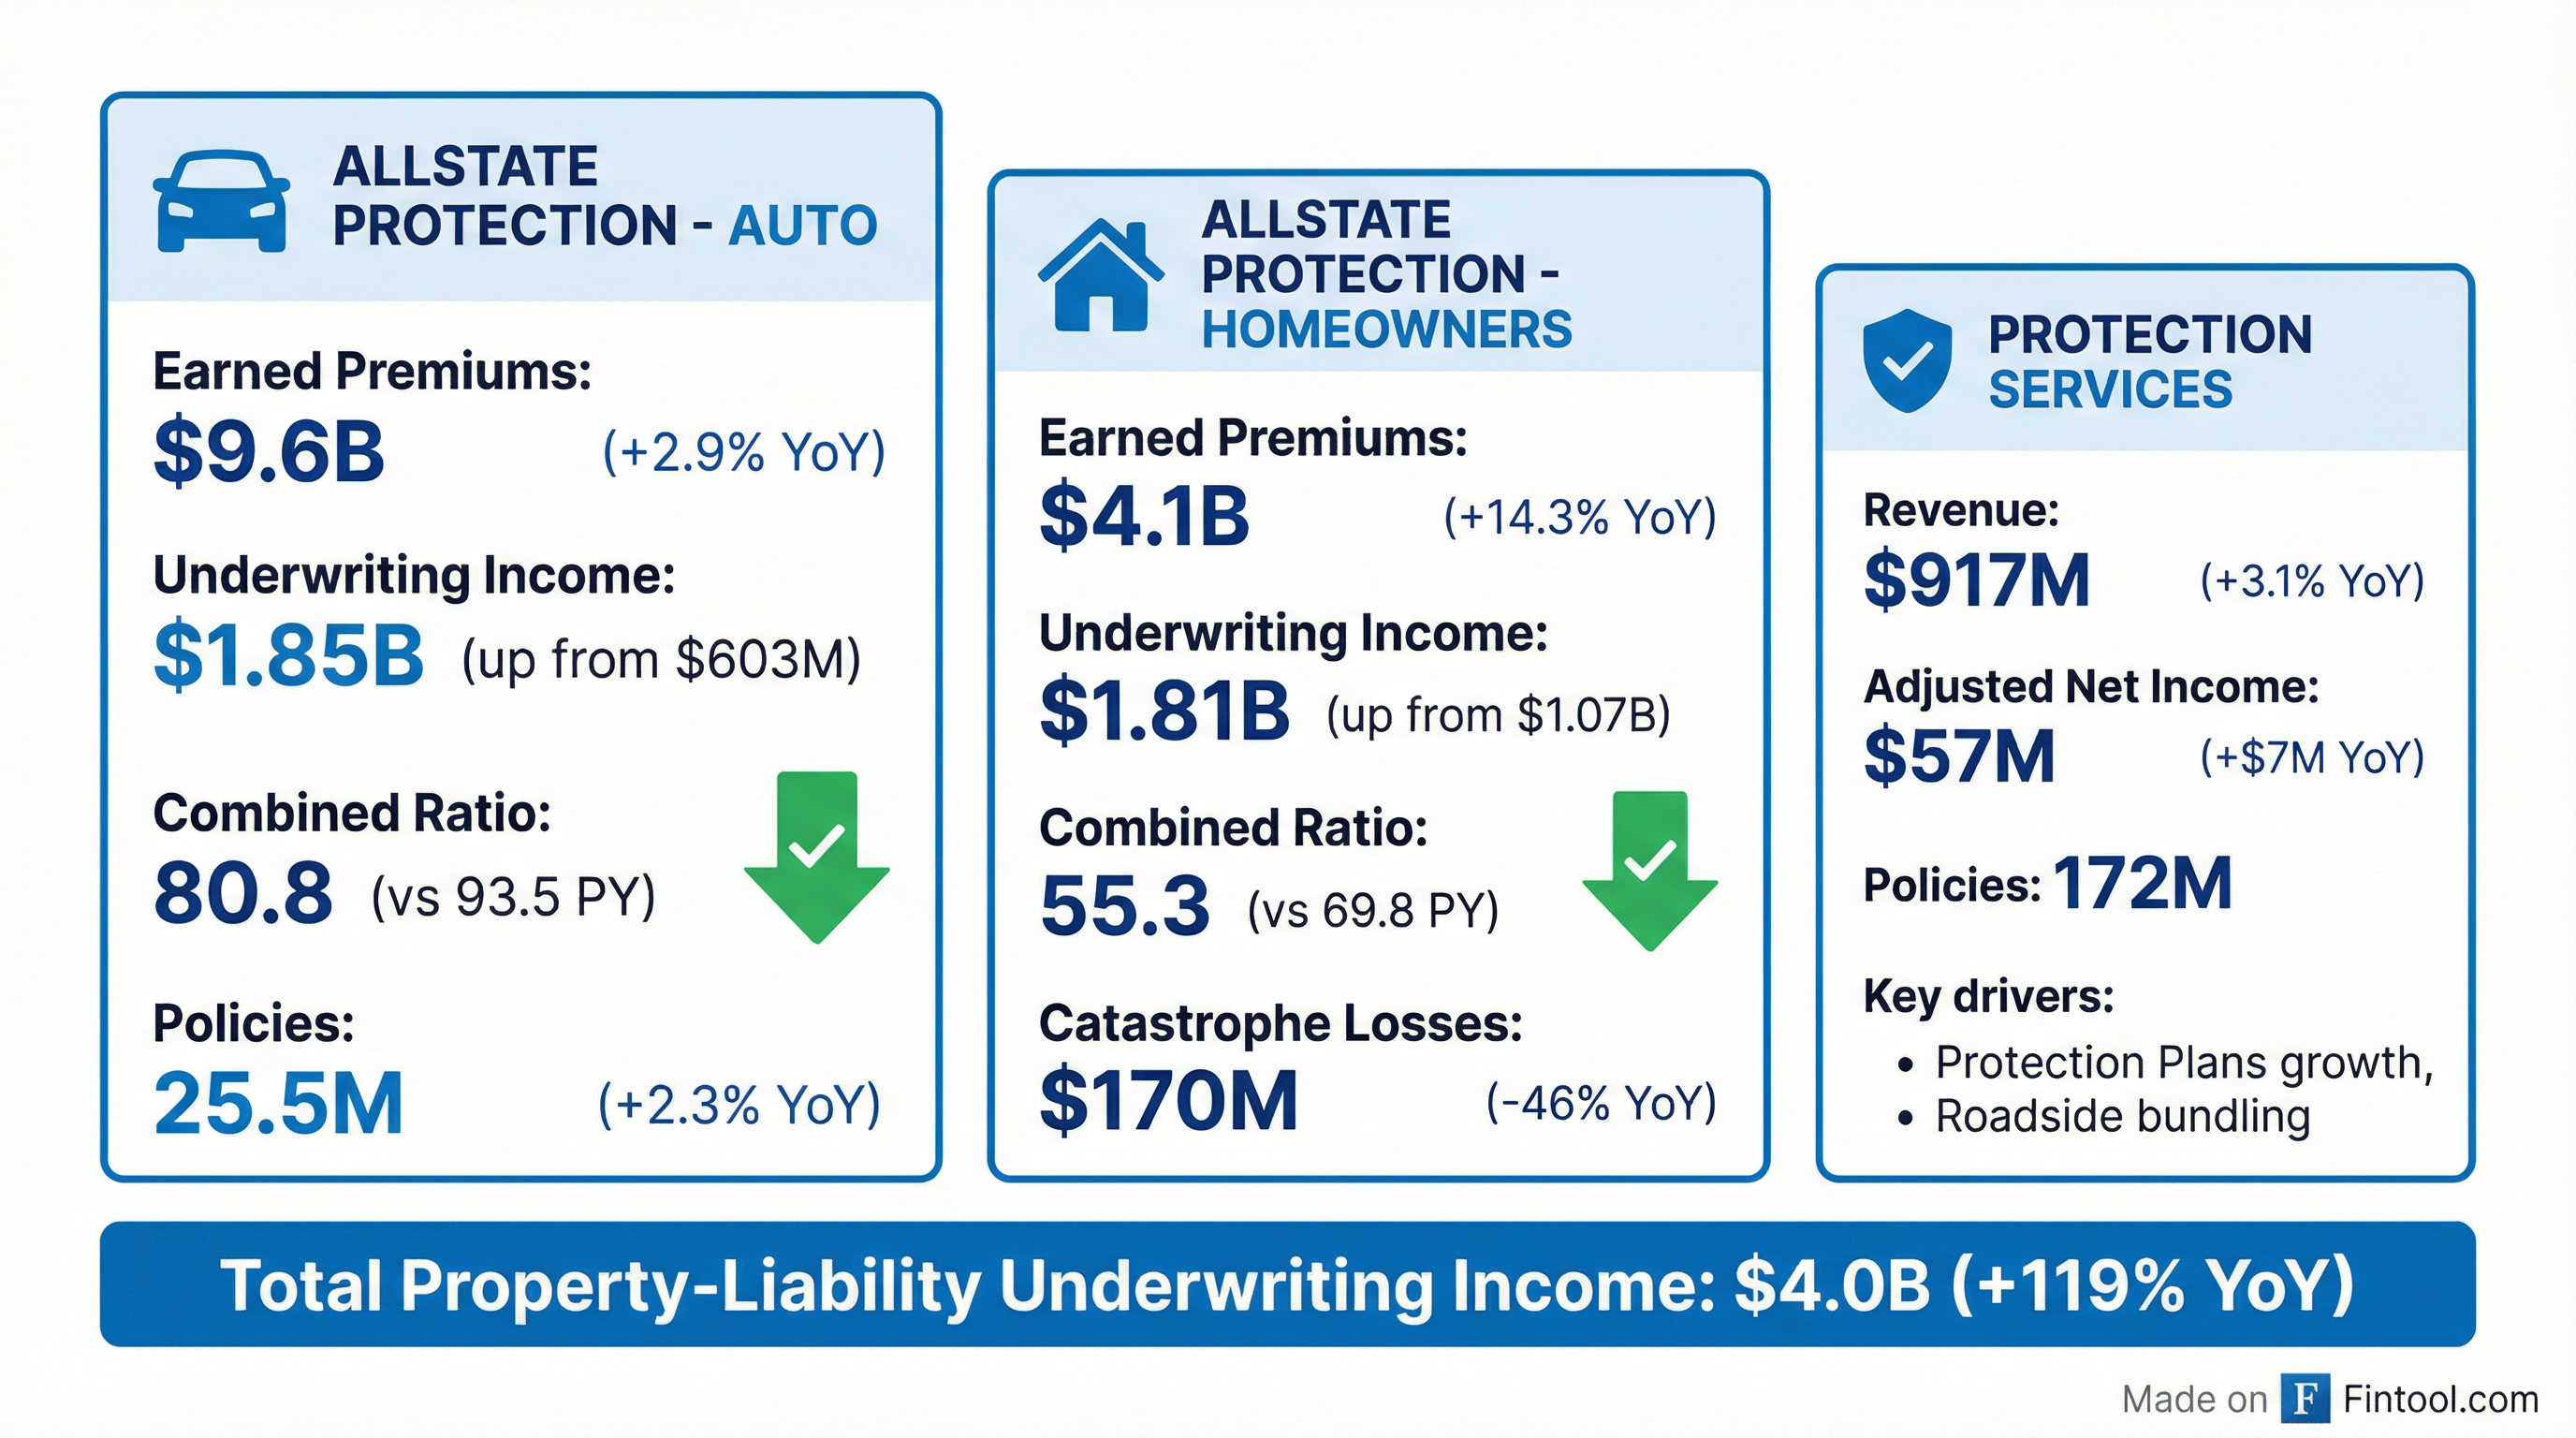
Allstate Protection Auto
Auto insurance delivered its best quarter yet under the Transformative Growth initiative:
The underlying combined ratio of 87.6 (excluding reserve releases) improved 5.4 points, as growth in average earned premiums exceeded improving loss and expense trends. Auto new business increased 22.8% YoY, driven by expanded distribution, increased marketing, and new products.
New Issued Applications by Channel (Q4 2025 vs Q4 2024):
Independent agency grew fastest at 27.9%, reflecting Allstate's strategic expansion beyond captive agents. Direct channel also saw strong momentum (+23.1%) as digital acquisition investments pay off.
Allstate Protection Homeowners
Homeowners insurance was the star performer, with a combined ratio of 55.3:
Average gross written premium for Allstate brand homeowners increased 7.4% to $2,267, reflecting continued rate increases and higher home replacement costs. The underlying combined ratio of 51.4 (excluding catastrophes and reserve changes) improved 8.1 points YoY.
Homeowners New Applications by Channel (Q4 2025 vs Q4 2024):
Direct channel homeowners applications nearly doubled (+86.5%), demonstrating successful digital acquisition for this traditionally agent-sold product.
Protection Services
Protection Services delivered adjusted net income of $57M, with revenue of $917M. Here's the sub-segment breakdown:
Protection Plans remains the growth engine (+15.3%), driven by strong international expansion. Roadside memberships increased to 1.24M (+64% YoY). Arity revenue declined 50% due to lower lead generation volumes, partially offsetting gains elsewhere.
Protection Plans Geographic Breakdown (Q4 2025):
International expansion is a key growth driver, with nearly 40% revenue growth in Q4 2025. Major distribution partners include Walmart, Costco, Home Depot, Target, and international retailers like Media Markt, SoftBank, and Telenor.
What Did Management Guide?
While Allstate doesn't provide explicit quarterly guidance, CEO Tom Wilson's commentary signaled confidence in the trajectory:
"Allstate had a terrific year by better serving customers and making protection more affordable. We proactively reduced premiums for 7.8 million auto and homeowners insurance customers by an average of 17% through tailored coverage reviews to offset cost inflation."
Capital Return Announcements:
- $4.0 billion share repurchase program to commence upon completion of the existing $1.5 billion program
- Dividend increased to $1.08 per share (+8%), payable April 1, 2026
- $2.2 billion returned to shareholders in 2025 through dividends and buybacks
Interim CFO John Dugenske noted that "total estimated statutory surplus increased to $23.0 billion, and the holding company ended the year with $7.5 billion of assets," supporting the aggressive capital return program.
2026 Transformative Growth Focus: AI and Platform Rollout
Allstate is entering Phase 4 of its Transformative Growth initiative, focused on deploying new technology platforms and AI capabilities:
Key 2026 Initiatives:
- Agentic AI Launch — Launching AI-powered purchase, service, and claims customer experiences
- Product Rollout Completion — Complete ASC (Affordable, Simple, Connected) and Custom360® product rollouts across remaining states
- Legacy System Retirement — Initiate retirement of legacy systems; transition customers from classic to ASC products
- Distribution Expansion — Broaden independent agent sales with Custom360® products, continue direct channel growth
AI in Claims Processing:
Allstate is already deploying AI tools in claims operations:
- Large language models for enhanced documentation and analysis
- AI-driven photo analysis to improve total loss predictions and valuation accuracy
- Predictive models to identify potential injured parties earlier, controlling liability exposure
- Redesigned claims operating model to accelerate payment to injured parties
The Transformative Growth initiative has reduced the adjusted expense ratio by 6.6 points since 2018 while enabling distribution expansion.
Investment Portfolio Update
Allstate Investments generated $892M in net investment income (+7.1% YoY), driven by market-based portfolio growth to $73.4 billion.
The portfolio duration stands at 5.1 years, with pre-tax yield on fixed income securities at 4.6%.
Investment Position by Strategy (Q4 2025):
The 10-year internal rate of return on performance-based investments stands at 11.1%.
Balance Sheet Strength
Allstate exits 2025 in the strongest financial position in years:
The deleveraging and equity growth position Allstate well for the announced $4B buyback while maintaining strong capital ratios.
Return on Equity Metrics:
The 42.3% GAAP ROE represents a 16.5 percentage point improvement from prior year, driven by the earnings surge and disciplined capital management.
Q&A Highlights: What Analysts Asked
Regulatory Environment and Rate Relief
Greg Peters (Raymond James) asked about regulators potentially mandating rate relief given improved profitability. CEO Tom Wilson emphasized that affordability is a nationwide issue—not just a political talking point—and that the real solution is cost reduction, not profit compression:
"Affordability for consumers is an issue everywhere... I'm hopeful that what this will do is put the attention on that needs to change. People don't need to be paying for lawyers and for fender bender lawsuits."
Wilson highlighted Florida's tort reform as a model, noting the top five insurers requested 5.9% rate reductions in 2025 after legislative changes reduced litigation costs.
Competitive Landscape
When asked about competition, Wilson acknowledged the three main rivals—Progressive, GEICO, and State Farm—but emphasized Allstate's multi-lever competitive advantage:
"We have many ways to compete at an individual level with all the different carriers, and nobody has all those levers... exclusive agents, independent agents, and direct business, allows us to compete differently in all the different product lines."
President Jess Merten added that Transformative Growth investments are paying off: 20 states are now picking up market share, and 38 states representing 70% of premiums are growing.
Autonomous Driving Impact
Bob Huang (Morgan Stanley) asked about autonomous driving's threat or opportunity. Wilson noted Allstate has been tracking this for 15 years with over 2 trillion miles of telematics data:
"The autonomous driving is, think of it, it's almost like safer driving... you have fully autonomous might be the safest because we take people completely out of it, but there are steps along the way."
Key insight: While frequency has declined from safety features, severity has increased because "you don't back into the pole when you're at the grocery store" but high-speed accidents remain severe. Additionally, replacing advanced equipment is expensive. The pace of change is limited by the $4 trillion of hardware (vehicles) that must turn over.
Claims AI: "Middle Innings"
Michael Zaremski (BMO) asked about AI in claims processing. Merten described Allstate as "middle innings" in the journey:
"This is proprietary to Allstate. We're not leveraging third-party insights or technology... the later innings probably be where you really see the benefit of artificial intelligence and the insights and tools that we can use."
Wilson used a memorable metaphor: "I think of claims kind of as a river of money. And at the top, you have us, and at the bottom, you have customers, and we have to get them the money. So as it goes down that river, lots of people dip into the river and take money out."
New York and New Jersey Update
David Motemaden (Evercore) asked about growth in NY and NJ. Merten confirmed both states are now profitable but not growing, with the key to growth being ASC product approvals:
"New Jersey, we recently got approval for implementation of the ASC product... in February. So we're going to be with the new product in market. New York, we're waiting for approval for the ASC product, so we'll be a little bit slower."
Capital Allocation and M&A
Elyse Greenspan (Wells Fargo) asked about M&A appetite given the $4B buyback. Wilson outlined the priority order:
- Organic growth first — get the multiple rerate from auto/home growth
- Strategic M&A — where Allstate is a "better owner" (e.g., SquareTrade, National General)
- Share repurchases — "We are long capital now... we think the stock is so cheap that it's a really good deal for shareholders who want to hang with us"
Since Wilson joined, Allstate has repurchased over 80% of shares outstanding.
Retention and Shopping Behavior
Joshua Shanker (Bank of America) theorized that retention may be permanently lower due to digital shopping. Wilson agreed shopping is up but noted new business growth exceeds the shopping increase:
"Shopping is up, and not everybody who shops switches, but shopping is up. So I would say yes, you would expect to see retention... The question is, how many of them do you keep?"
The "connected" part of ASC is critical—building ongoing relationships makes customers less likely to shop.
Key Risks and Watchpoints
-
Rate Pressure Ahead: With 7.8 million customers receiving an average 17% premium reduction via the SAVE program, near-term earned premium growth may moderate. The cumulative earned premium impact from rate decreases and SAVE actions reached $810M by Q4 2025 (Q1: $88M, Q2: $296M, Q3: $545M, Q4: $810M). Additionally, Allstate implemented auto insurance rate decreases averaging 9% in 32 states for the ASC product.
-
Reserve Development Sustainability: The 5.4-point benefit from prior year reserve releases is unlikely to repeat. Underlying combined ratios remain the key metric to watch.
-
Catastrophe Volatility: Q4's benign catastrophe experience ($209M) is not guaranteed. Full-year 2025 catastrophe losses were $5.0B, similar to 2024.
-
Arity Decline: The 50% revenue drop in lead generation at Arity warrants monitoring.
-
New York/New Jersey Growth Stalled: Both states are profitable but not growing; awaiting ASC product approval in New York.
Forward Catalysts
The Bottom Line
Allstate's Q4 2025 was exceptional by any measure. Adjusted EPS nearly doubled, the combined ratio hit 72.9, and book value per share jumped 50%. The $4 billion buyback announcement and 8% dividend raise demonstrate management's confidence in sustaining elevated returns. The key question for 2026 is whether the underlying combined ratio (76.6 excluding reserve releases) can hold as competitive pricing pressures increase. With 38.3% adjusted ROE and strong policy growth, Allstate enters 2026 from a position of strength.
Read the full 8-K filing | View earnings transcript | Allstate Investor Relations